A ballpark that senses,
thinks, and answersfor itself.
Harborview Harriers vs. Northgate Sentinels · GAME 54 · Bottom 5th. 214 4K cameras, 1,284 IoT sensors and 18 edge inference nodes judge 12 hazard classes in 0.5 seconds — every call backed by reviewable footage.
Crowd Density
Open digital twin →Inflow / min
91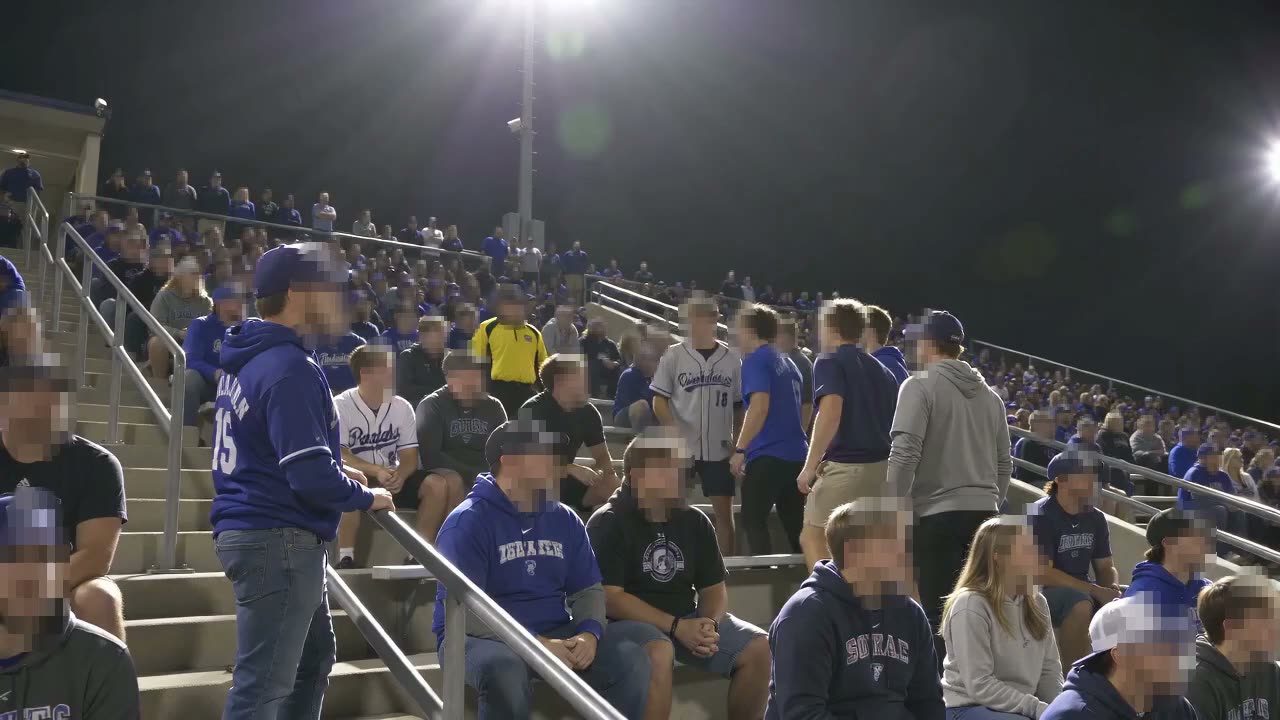

10 Core Modules
per PRD §3Ask the venue a question, get the answer plus the footage that proves it
Multi-stream AI labelling, event triage and video verification
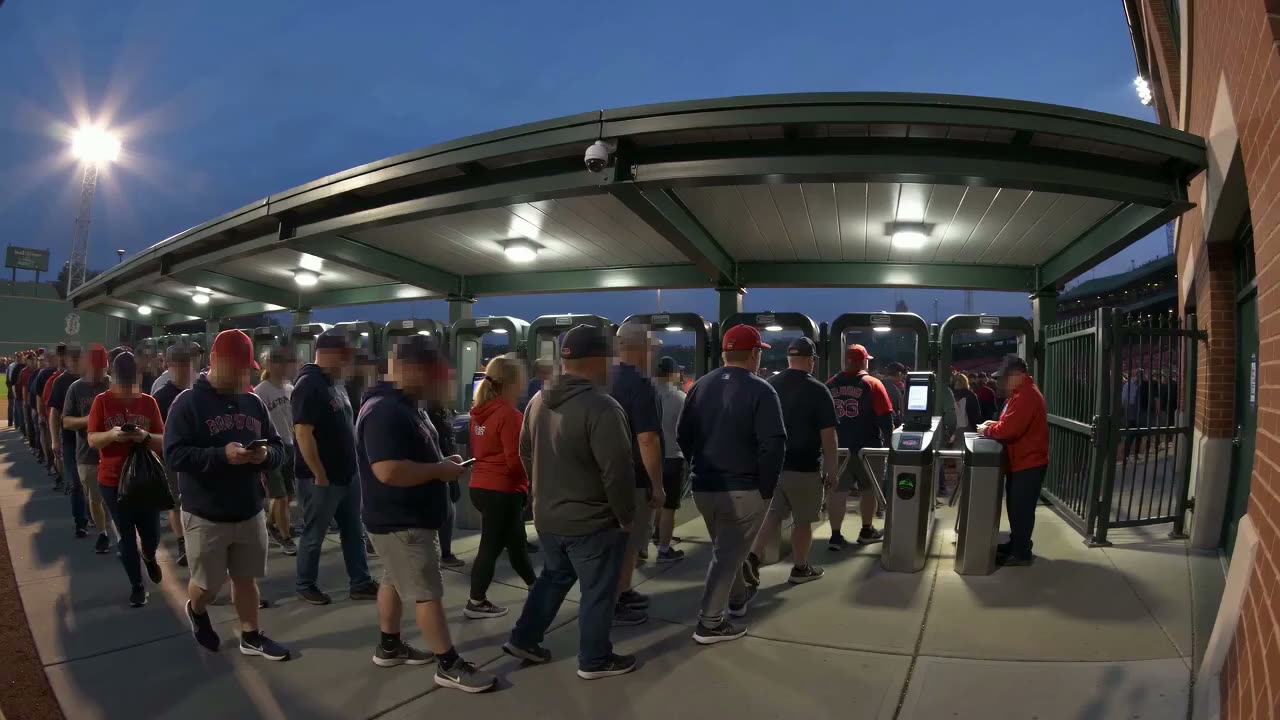
Throughput, wait time and crush risk across all six entrances
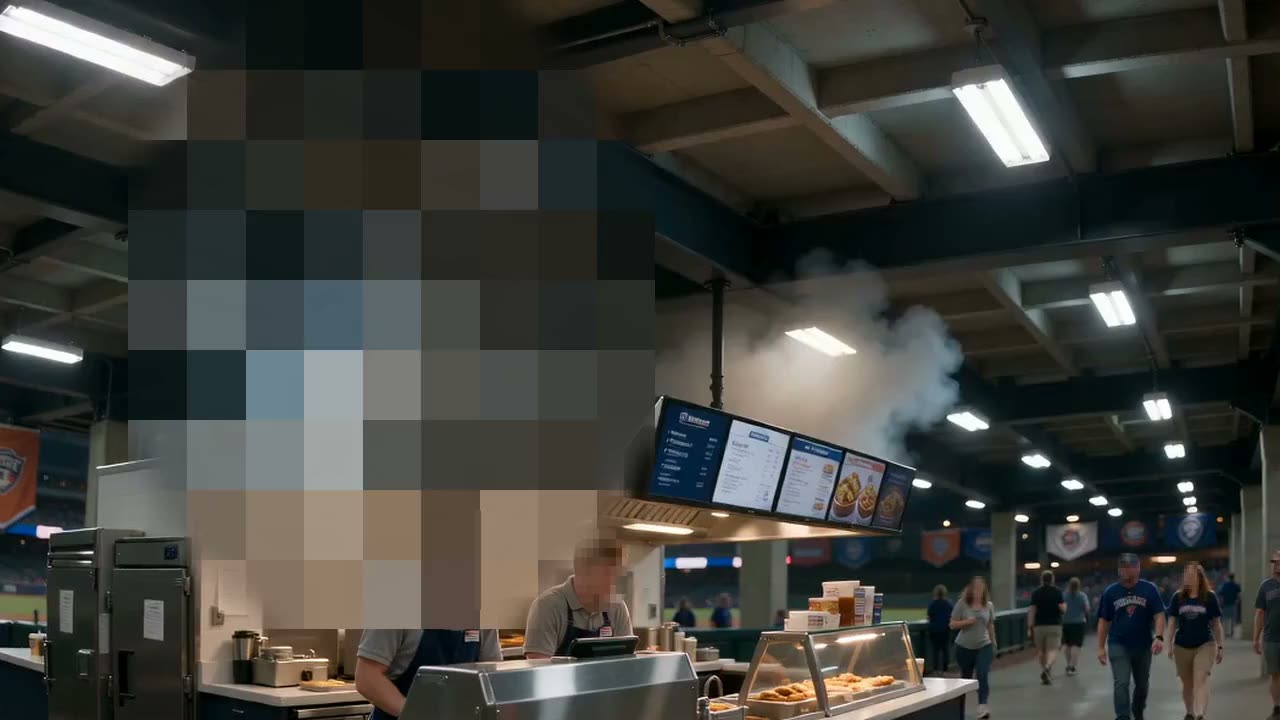
Queue-length prediction, automated rerouting and recovered revenue
CV fill-level estimation with current vs. recommended placement
Detect → Dispatch → Resolve → AI re-verification, end to end
Zone clearance times, bottleneck prediction and reroute paths

HVAC, electrical load, solar generation and air quality x-ray
1:1 stadium model, crowd heatmap and incident timeline replay
Pre-game, in-game, stretch and egress on one command wall
Ingress Timeline
Actual vs. predicted Actual PredictedGame Night Timeline
Command wall →All six gates open; AI Director switches to ingress mode
Ballpark Way hits 92/min; Gate C begins to back up
Food & beverage revenue up 240% in 30 minutes
Bowl occupancy 84%; switching to in-game monitoring
HAZ-007 fired; AI cleared it as a false positive in 47s
Corridor B2 door held open past the 5-minute threshold
Section 108 bins at 118% fill level
Beer spill in Section 28; custodial order created automatically
18 people queued; recommend opening Gate D overflow
Tier 1 medical event; EMS Unit 2 on scene
HAZ-002 fired; Patrol 4 dispatched, three views switched
Restroom and concession peaks predicted; crews pre-staged
3D model estimates full clearance in 8m 42s